Power BI for Sport Scientists - Level 1 vs. Power BI for S&C Coaches - Level 1
Nov 14, 2024
By Ciaran Deely
Sport Horizon offers two tailored Power BI courses for professionals working with sports data. Here’s a quick look at the key differences:
- Power BI for Sport Scientists - Level 1: Focused on team-level GPS data and training load analysis, ideal for sport scientists tracking match and training performance across teams.
- Power BI for S&C Coaches - Level 1: Designed for individual athlete monitoring with a focus on fitness testing, gym load tracking, and readiness metrics—perfect for S&C coaches managing athlete performance and injury prevention.
Each course addresses unique data needs, helping professionals leverage Power BI for impactful sports insights.
Power BI for Sport Scientists - Level 1
Audience: This course is designed for sport scientists and performance analysts who work primarily with GPS data, training load metrics, and performance monitoring across various sports.
Content Focus:
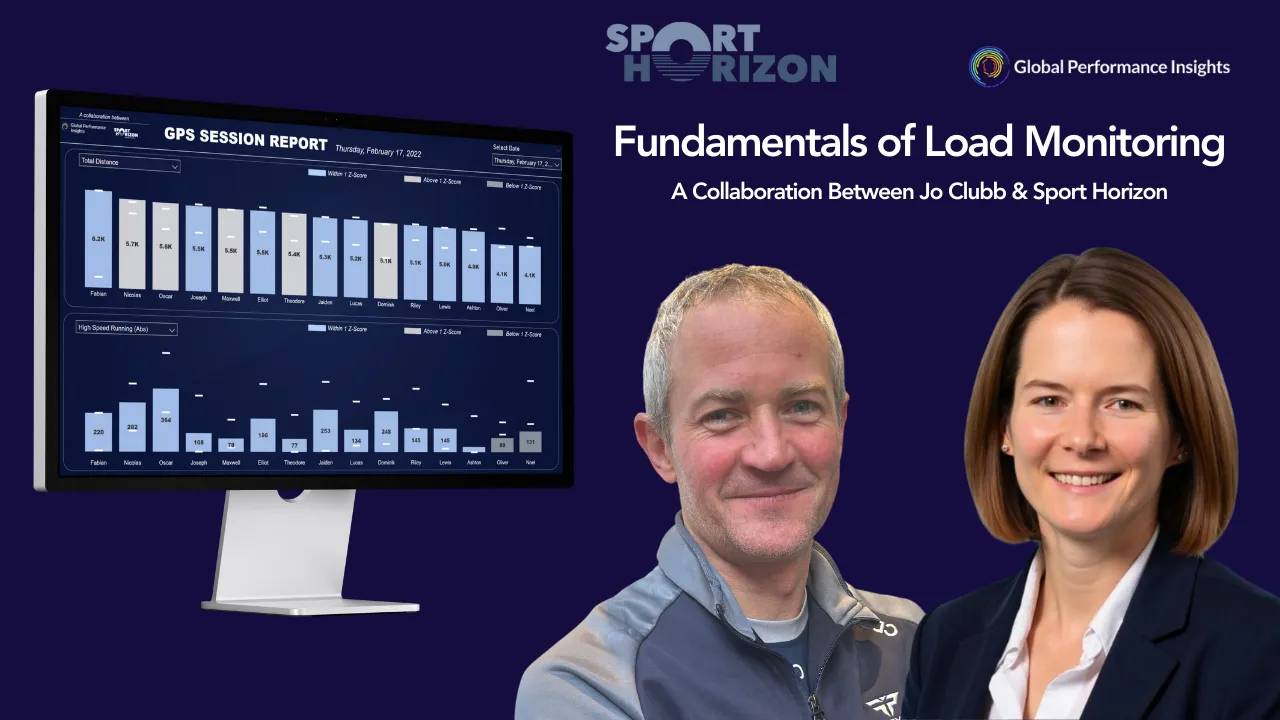
- GPS Data Analysis: Learn to import, clean, and visualise GPS data, including metrics like distance, speed zones, and high-intensity runs.
- Training Load Visualisation: Create dashboards to monitor training loads over time, identifying trends, peaks, and recovery needs.
- Match-to-Match Analysis: Track and analyse game-day performance metrics to compare against historical data or benchmarks.
- Performance Trends: Set up visualisations for tracking key performance metrics such as accelerations, decelerations, and player load.
- Data Contextualisation: Learn to contextualise data, adding insights for coaches and staff to make data-informed decisions.
Key Use Cases:
- Suitable for practitioners focused on team-level GPS data analysis.
- Ideal for sport scientists working with GPS providers like Catapult or Statsports to understand training demands.
- Enables users to monitor match intensities, recovery windows, and player readiness over a season.
Power BI for S&C Coaches - Level 1
Audience: Tailored for Strength & Conditioning (S&C) Coaches who primarily focus on athlete performance metrics, fitness testing, and load management in the gym and field settings.
Content Focus:
- Athlete Load Tracking: Build dashboards for tracking individual and team workloads, focusing on metrics such as gym load and conditioning sessions.
- Performance Benchmarking: Create visual reports for CMJ (Countermovement Jump), sprints, and endurance tests, allowing S&C coaches to benchmark and assess athlete progress.
- Training Attendance and Compliance: Set up attendance dashboards and monitor athlete engagement in training sessions.
- Readiness and Recovery Monitoring: Design visual tools to track metrics like RPE (Rate of Perceived Exertion) and recovery scores, aiding in load management and injury prevention.
- Progress Tracking Over Time: Build visuals for tracking progression in gym-based metrics, sprint speed, agility, and overall physical preparedness.
Key Use Cases:
- Perfect for S&C coaches who want to analyse gym-based performance data and field-based conditioning data.
- Tailored for coaches looking to prescribe and monitor training loads, making data-driven adjustments to maximise athlete readiness.
- Focuses on individual athlete monitoring rather than broad team GPS data, making it ideal for physical preparedness and injury prevention.
Summary of Key Differences
Primary Focus:
- Sport Scientists - Level 1: Emphasis on GPS data, training load analysis, and team-level performance insights.
- S&C Coaches - Level 1: Focused on individual athlete metrics like CMJ, sprint, and endurance data, with a strong emphasis on load management and fitness testing.
Data Sources:
- Sport Scientists - Level 1: GPS and match performance data from devices like Catapult, Statsports, or other tracking tech.
- S&C Coaches - Level 1: Primarily fitness and gym-based metrics, tracking athletic development and readiness.
Reporting Style:
- Sport Scientists - Level 1: Team-centric dashboards for tracking aggregate data and visualising training intensity patterns.
- S&C Coaches - Level 1: Individual-focused dashboards for tracking athlete performance, load compliance, and progression over time.
Each course is tailored to meet the specific needs of its audience, with Power BI for Sport Scientists - Level 1 geared toward team-wide data analysis and training load visualisation, while Power BI for S&C Coaches - Level 1 is focused on individual performance tracking and physical readiness monitoring for S&C professionals.
Find out more here:
Sport Scientists - Level 1: https://www.sporthorizon.co.uk/powerbi-course-info-level-one
S&C Coaches - Level 1: https://www.sporthorizon.co.uk/powerbi-course-info-level-1-s&c
Stay connected with news and updates!
Join our mailing list to receive the latest news and updates from our team.
We hate SPAM. We will never sell your information, for any reason.


